GeoTomCG
3-D
tomographic Windows software from GeoTom, LLC
 · 3-D and 2-D tomographic inversions for
velocity or attenuation.
· 3-D and 2-D tomographic inversions for
velocity or attenuation.
· Many
years of program development guided by processing field data.
· Versatile
methods for using site information for more reliable results.
· Plots
for quality control of data and optional data weighting.
· Displays
showing goodness of fit for traveltimes and calculated velocities.
· Economical, only
$600 (academic $500).
· Instrucciones sumarias en
español e inglés.
Summary instructions in Spanish and English.
GeoTomCG
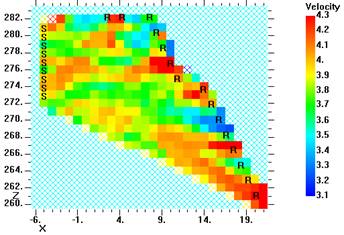
can process and display 2-D and 3-D crosshole or VSP seismic or radar
data. The display above shows calculated
seismic velocities from a dam in Taiwan being investigated for earthquake damage1.
S and R indicate source and receiver
positions, respectively. The crosshatch
pattern indicates areas with few raypaths.
The investigators reported that the seismic velocities were consistent
with results obtained by other geophysical methods.
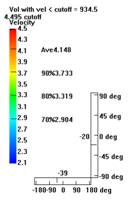
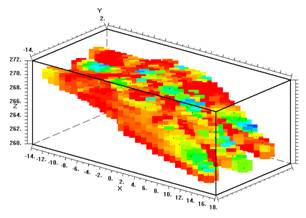
The
display to the left shows a 3-D display of
the calculated velocities in the dam.
The 3-D displays can be rotated and tilted. Low velocity zones inside a
3-D volume can be displayed with a cutoff velocity. Only zones where the velocity is below the
cutoff velocity are colored.
GeoTomCG can export results for display by
commercial 2-D and 3-D graphics programs such as Surfer®, Voxler®, Tecplot®,
and SlicerDicer®. A 3-D display from Tecplot
of results calculated by GeoTomCG is shown to the right. This display shows questionable
locations (velocity 3.0 to 3.6 m/ms, green-yellow) in the dam in Taiwan1.
1Application of Elastic Wave Tomography for Dam Safety. Sheng-Hsung Hsieh, Chih-Hsin Hu, Chih-Hsien
Hsieh , Jen-Kai Huang, Cheng-Yang Yen, Wen -Lung Chi, and Chao-Ming Lin. Presented at SAGEEP 2012, Tucson, AZ, USA, Mar. 25-29, 2012, Poster Session Two, Wed.
Mar. 28. hsung@hckgeo.com.tw, H.C.K.
Geophysical Company
![]()

GeoTomCG features and options
Traveltimes (or amplitudes) can be processed to calculate velocities (or
attenuation). Sources and receivers can be anywhere within a 3-D grid.
Anisotropy can be specified for each grid point. Raypaths can be straight or
curved. An option allows the influence of data on the inversion to be weighted according
their specified quality.
Options for using site information to
improve the reliability of results include:
1. Maximum and minimum calculated velocities.
2.
Constant velocity in user-selected areas or volumes in the grid.
3.
Groups of nodes with similar velocities, such as horizontal layers or vertical
columns.
4. Constraints
that take into account the uncertainty in site knowledge.
5. Adjustable
damping and smoothing to reduce small-scale variations in calculated velocity.
GeoTomCG runs under Windows and provides
graphical displays of velocities, raypaths, raypath densities, slowness
residuals, and other parameters for inspecting results and preparing reports. Displays
can be copied and pasted with the Windows clipboard. Quality control plots
include traveltime vs. distance, residual vs. raypath angle, velocity vs.
raypath angle, common-source and common-receiver gathers, and others. Text files of 3-D results and 2-D slices of
the 3-D grid can be read by commercial 3-D and 2-D visualization programs. Results can be compared by differences or
ratios. Examples with files allow the
user to practice traveltime and amplitude data processing. The time and
amplitude picking program TomTime, described
in a separate information sheet, provides output in a format read by GeoTomCG.
Client data processing
GeoTom has many years of experience
processing clients’ tomographic data. That
experience and the familiarity with the programs as the developer provide
efficient and reliable data processing. Clients can provide traveltimes (or
amplitudes) picked by the client or seismograph files for GeoTom to pick times
(or amplitudes). Processing amplitudes
is more complex than processing traveltimes and the reliability of results can
be adversely affected by scattering at interfaces.
Customers’ comments
Over 100 copies have been sold
worldwide, with many favorable comments from users. Julian Ivanov of the Kansas Geological Survey
wrote, "GeoTomCG is very well designed and organized 3-D Tomography
software. It is very user friendly! My needs as a customer were very well
anticipated and met. Time-consuming tasks, like model building, are
automatically handled. Also, I've been very pleased with the prompt and
efficient customer support." Jim
Hasbrouck of Hasbrouck Geophysics, Inc. wrote, "The combination of TomTime
and GeoTomCG has provided efficient, robust and accurate processing and
interpretation of the numerous surface to borehole seismic and crosshole
seismic surveys that I have conducted.
Questions on the operation of the programs or methods for improved
results have always been addressed in a timely and helpful manner by Dr.
Tweeton. I highly recommend the use of
these computer programs for applicable projects."
To purchase
The commercial price for the program,
documentation, and eight hours of support is $600. The academic price is $500. GeoTomCG can be purchased from GeoTom or from
these resellers:
Sensors &
Software Inc, Mississauga, Ontario Canada, 1-800-267-6013 or 905 624-8909,
e-mail sales@sensoft.ca.
GISCO, St. Louis Park, MN, phone 1-800-523-1526 or 952 929-8000, e-mail
Daryl.Tweeton@giscogeo.com.
Olson Instruments, Wheat Ridge, CO, (303) 423-1212, e-mail info@OlsonInstruments.com.
Geotomographie,
Neuwied, Germany, fax 49 2631 778136, e-mail TFechner@geotomographie.de.
Geo2X - W_GeoSoft,
Oulens, Switzerland, fax 41 21 881 48 00, e-mail jacques.jenny@geo2x.com.
Idrogeostudi,
Catania, Italy, fax 39 095 433222, e-mail foresta@idrogeostudi.com (exclusive
reseller for Italy).
P.A.S.I. srl,
Torino, Italy, fax 39 011 658646, e-mail info@pasisrl.it
(for customers outside of Italy).
GeoTom, LLC Tomographic software E-mail sales@geotom.net
13785 Diamond Path and data processing Website
www.geotom.net
Apple Valley, MN 55124 USA
Phone or fax (1) 952 423-3838